For the past three months, the Bitcoin economy has undoubtedly been in a correction phase. The number of major new adoption announcements has dissipated, companies like BitPay and Coinbase have quietly ceased to provide weekly updates on their processing volume and number of new customers, and media attention has significantly died down since the sudden burst of both positive and negative attention in April. The Bitcoin price has slipped through one floor after another, dashing hopes that it would exceed $500 by the end of the summer. Google Trends volume has slowly declined, usage statistics have faltered and legal troubles have led to bitcoins becoming harder to buy as quickly as exchanges keep trying to make it easier; in fact, the most rapidly growing way of buying bitcoins today is on the streets. Now, however, three months after the greatest carnage immediately following Bitcoin’s massive rise to $266, it is time to take another look at where Bitcoin is going, and consider what the next steps are for the Bitcoin economy as a whole to take.
First, the price. The events of early June brought a considerable amount of pessimism to the Bitcoin community as a powerful upward trendline starting from even before the largest part of the price bubble was broken. Within days, Bitcoin dropped to $100, and even that level was pierced at the beginning of July as there was simply not enough demand to maintain the price point. What happened in the past month, however, is surprising. Not only did the price make an unexpectedly strong comeback from its low at $65, but it also managed to maintain it, resulting in a sustained upward correction that has now erased essentially 100% of the month’s losses. The price today is essentially the same as the price at the beginning of Porcfest in mid-June. In fact, the rise has sustained itself so well that, just in the last few days, the downward trendline that has dominated Bitcoin price movements since the crash from $130 in June has quietly been broken. This creates some evidence that, perhaps, the price is positioning itself to treat $100 as a long-term point of stability – similar to $5 in early 2012.
A Reddit user has provided another interesting chart comparing the Bitcoin price in 2011 and 2013; there, the conclusion is similar: Bitcoin’s decline this year was closely following the same pattern as its decline after the bubble in 2011 all the way up until July 10, but since then Bitcoin this year has made an unexpected and decisive comeback.
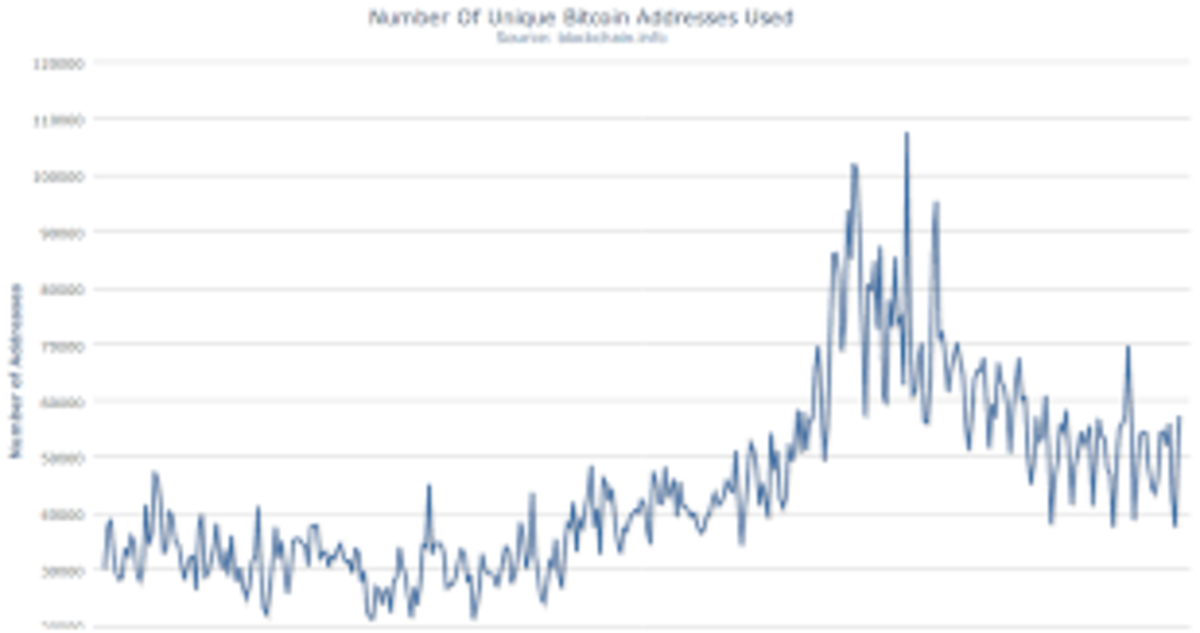

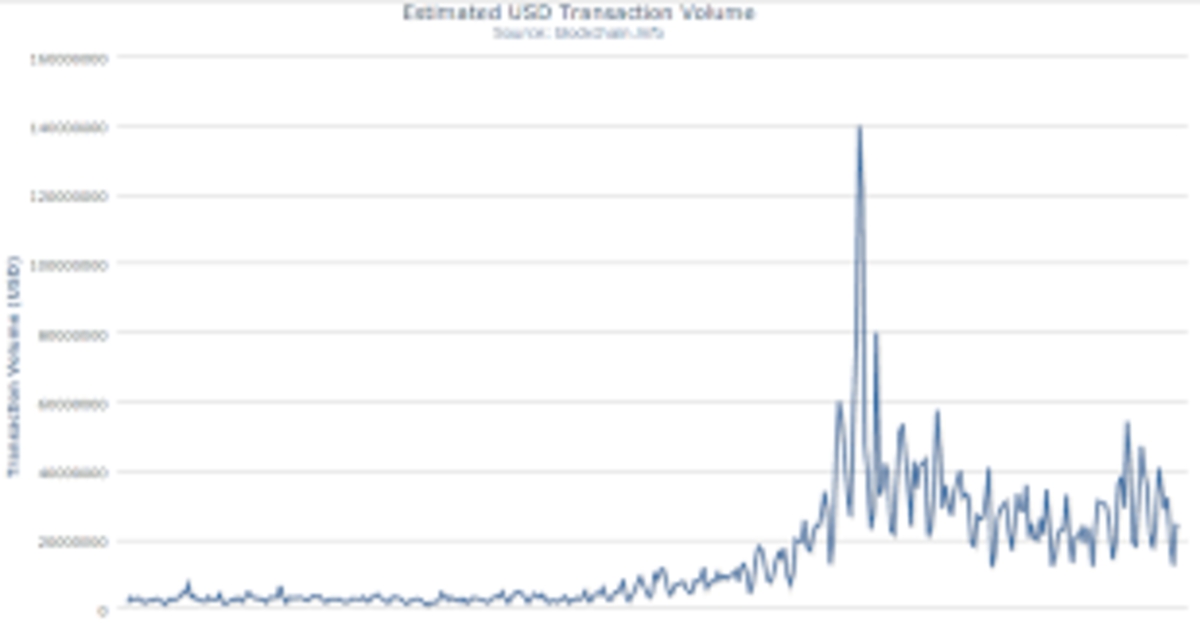

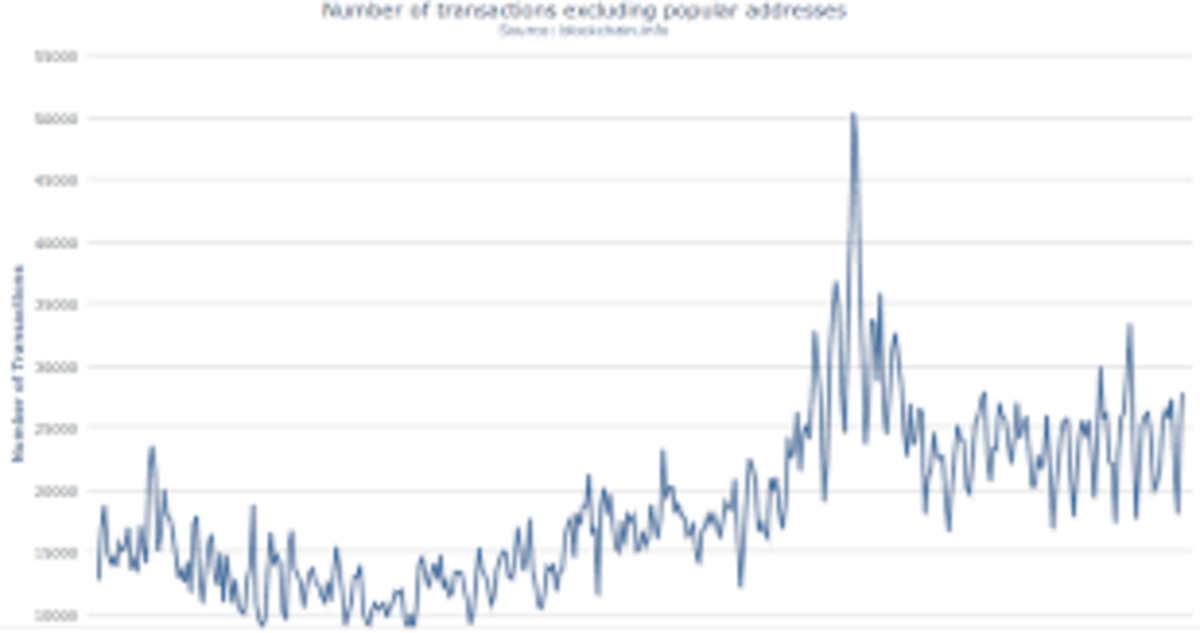
Here we see four different statistics from blockchain.info: the number of unique addresses used, the number of transactions per day, the number of transactions excluding popular addresses (in practice, this means certain mining pools and gambling sites) and the estimated USD transaction volume. All four of these show signs of stopping their decline of even recovering, although for the number of transactions per day it is still too early to tell if the last two weeks are merely a statistical blip. All in all, the evidence looks very positive.
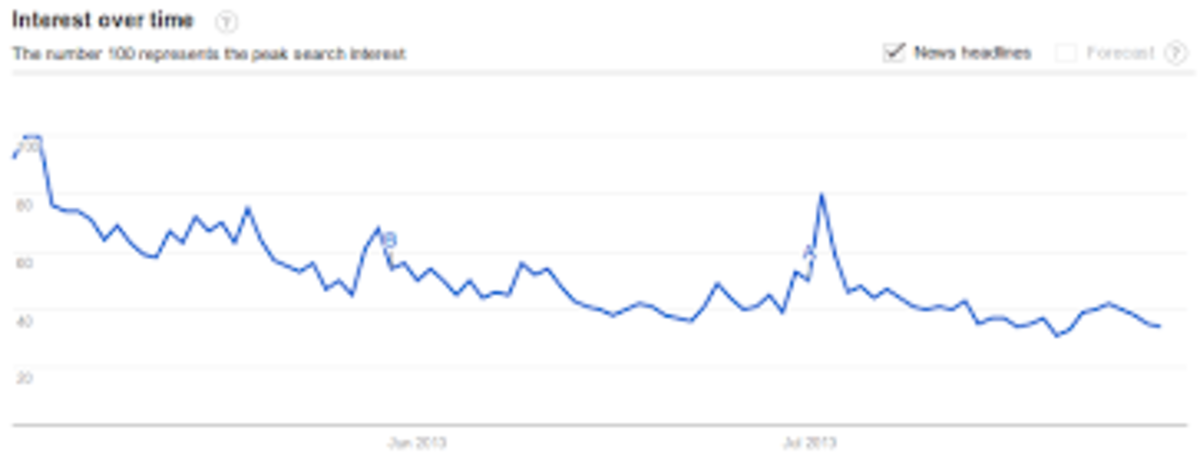
Here is the one chart that provides some reason for further pessimism – the Google Trends volume. Searches for Bitcoin are continuing to decrease, and the four days with the lowest search volume since the bubble have all been in the last four weeks. However, history shows that Google Trends volume needs to be viewed carefully as an indicator of interest. One theory is that the Google Trends volume represents the derivative of the level of interest in Bitcoin more so than interest in Bitcoin itself. That is to say, most Bitcoin users who are already deeply involved in Bitcoin do not go around Google-searching it; rather, they simply head straight to their own projects or community hotspots like reddit.com/r/bitcoin, Bitcointalk or news sites like our own. People looking up Bitcoin on Google are thus by and large only potential new users. Hence, a 50% decline in the Google Trends volume does not mean that the Bitcoin community has become half as large; it simply means that it is growing half as quickly. Google Trends volume has consistently lagged behind other indicators in the past; for example, the indicator hit its post-2011-bubble low one month after the lowest point in the price, somewhat corroborating this hypothesis.
So what does all this mean for the future of Bitcoin? In general, it is further evidence for the Bitcoin economy’s high level of resilience. Even as the shadow of the April 2013 crash still looms over us, the underlying Bitcoin economy is continuing to grow, and it is our job as a community to continue to support it. The next great Bitcoin bubble, if it comes, will likely not come for a while; it may well be that the next year or so will be a time for the new class of Bitcoin entrepreneurs to further integrate itself into the community and develop its products and services, and only after a long time will we see an overt wave of public attention once again. In the near term, some kind of bubble similar to that in January 2011 may potentially happen, although history is unlikely to repeat itself so neatly. For now, keep using Bitcoin, keep developing great projects and services, and enjoy the ride.
