Over the past month or so, we have seen Bitcoin’s price leave the comfortable range of $10 to $14 that they had been at for nearly four months and embark on a steady course upward that has almost precisely doubled its value since then. The long road up first started on January 6 when, several days after striking the January 1 low of $13.16, the currency began a slow and steady rise of about $0.15 per day. But it did not really pick up until January 16, a point a few days after the currency broke through $14 for the first time since August where Bitcoin’s value spiked up suddenly to about $14.7. From there, $15 fell quickly and a stream of steady, progressive growth ensued.
The first shock came on January 25, just after the price first broke 19:

Bitcoin precipitously fell to $18, then $16, then finally, after a brief but temporary recovery to $17.3, hit a low of $15.6, erasing all of the progress of the past… four days. From there, however, the price simply picked back up on its course, and kept going. The next run down happened from $20, after the price struck against $21.5, failed to get further, and struggled for two days before suddenly collapsing the moment it went below the $20 threshold.

But from there, the recovery was rapid. There was no double-dip, and the price spiked back up to pre-drop levels within twelve hours. It fell back to $19.5 for a few hours and then stayed at $20 for a day, but then Bitcoin’s growth simply resumed, almost as if nothing had happened.
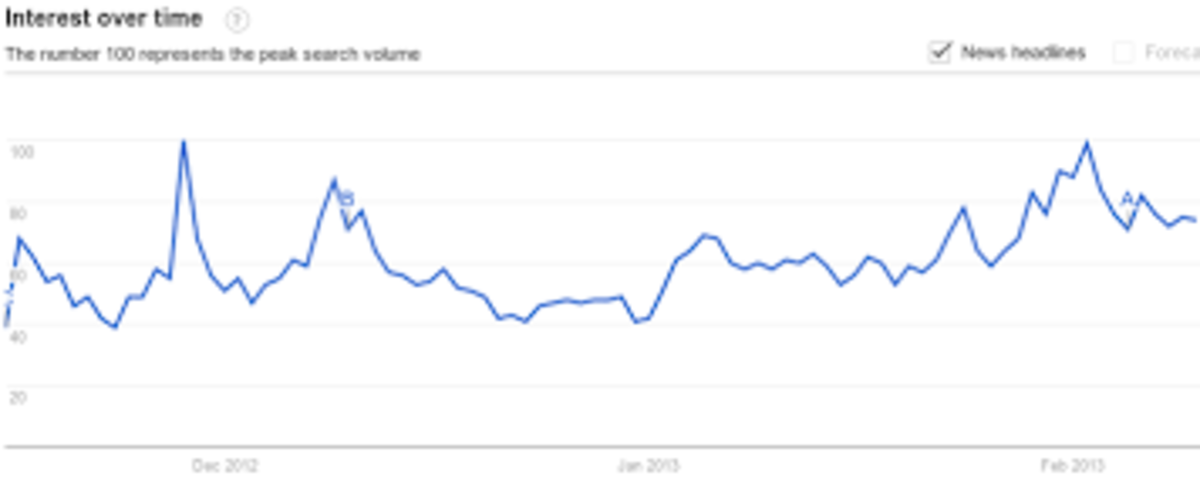
The third leg, however, has been different. Unlike the first two legs, which were helped along by a background of constant positive news involving Bitcoin’s merchant service providers, positive media attention, and the gambling sector, since then attention on Bitcoin has quieted down somewhat. The Google Trends volume, which hit its highest levels since November on Feb 2, has since receded somewhat, albeit at a higher level than before the rally first started:
The price continued soaring, climbing an average of fifty cents per day, but signs slowly began to change. The “ask” (selling) side of MtGox’s order book, which was thin enough that a buyer with $600,000 could have brought the currency past the holy grail of $31.91 at $19, has since thickened to the point of such a jump requiring over $1 million to create, despite the current price being twice as close. Bitcoin exchanges’ trade volume decreased – a common sign that a trend may be nearing completion. For ten days the price kept climbing, touching $26.3 on February 13, but then finally the market changed. The price began to slide down – slowly at first, but then more quickly once it broke below its two-day trendline, and the market entered panic mode once the price lost its key psychological threshold of $25:

However, although the fall was deep, it was also brief, and once the drop encountered serious resistance in the $21.8-$22.8 range it quickly spiked back up again. Even more rapidly than it fell, it rose back to $25.48, and after a brief slump back to $24 went on to hit $26.65, even higher than the $26.3 peak that the price had reached the day before.

What are the lessons that we can extract from this whole ordeal?
- At least for now, it seems like the market does not even want a correction. Traditional technical analysis theory introduces a concept of Fibonacci retracements, where a price correction backtracks 38% or 62% (three eights and five eighths, both ratios between small Fibonacci numbers) of the rally’s gains, and a correction within a correction – the spike back up that inevitably follows a fall – itself tends to follow the same patterns. Here, the conventional wisdom has been broken. Bitcoin fell down, but within hours it came back even stronger.
- Psychological thresholds matter. In the last two price charts above, one can clearly see how the price began to drop quickly once it broke below a key psychological threshold that Bitcoin had gained only a few days earlier. A trading strategy that Bitcoin traders may wish to consider is setting up an automated sell order that would trigger whenever the price breaks below a round number (eg. $25, $30, $40) that it had not gone below for at least a day prior.
- Trendlines matter. Although with Bitcoin’s ups and downs it may seem hard to believe, over the past two years the currency has in fact been following a single, consistent trendline of gentle exponential growth:

Note the log scale on the right, which makes any exponential curve look like a straight line. Notice how every time the price threatened to fall, or simply stagnate, below the line it somehow always spiked back up just in time. This time is no exception. At the beginning of January, the price had simply been at the $10-$14 level far too long, and it was threatening to break the pattern, and so just in time it got the upward boost that it needed. Now, we are well above this line, and so there is considerable room for Bitcoin to fall, but in the near term there is another trendline to watch:

Notice how the three times that the price quickly fell it did go below the line. But then, it quickly came back up again. Unless Bitcoin starts seeing exponential growth in public attention and business adoption within the next few weeks the trendline will likely break, and we may well enter another period of stagnation backed up by the lower trend, but for now the markets appear intent on keeping at it.
So what factors are there to show that this recent doubling is backed up by genuine adoption, and not merely a bubble? There is not as much news as in January, but there are a few items to keep in mind:
- Yesterday, the Bitcoin Reddit community and the Bitcoin poker site Seals with Clubs both saw a large volume of users. Reddit broke past 300, over three times its usual volume of 100. Seals with Clubs saw over 200 users online at the same time.
- Coinbase reached its maximum level of purchases. The Bitcoin exchange intermediary had also reported their volume exceeding $1 million per month just a few days earlier, and the more recent news suggests that Coinbase will only keep getting more popular as time goes on. Coinbase’s popularity is not without good reason; its service allows users to buy Bitcoin straight from their bank accounts, paying only a 1% fee for the exchange – market spread included. The fact that it is gaining popularity suggests that a growing number of people are becoming aware of this convenient way to buy bitcoins, and is a positive sign for Bitcoin’s future in a number of ways.
- Bitcoin fundamental statistics are continuing to improve, although not as quickly. We have already seen how Google Trends volume has gone up by 50% since the start of the rally. The number of transactions hit a new high of 68,000 in a day a few days ago, although the number of transactions excluding popular addresses has gone down somewhat. The graph of the blockchain size has turned slightly upward in slope, and the Blockchain wallet’s number of users, although no longer growing as rapidly as it did in December and January, is continuing to increase.
Thus, we are at an interesting point in Bitcoin’s growth. Some technical indicators point to Bitcoin only getting stronger, as every drop is met with more resistance and sees a quicker comeback than the last, although some other evidence suggests that the rally may soon cool down to some extent. Many are predicting a rise above the $31.91 all-time high in June 2011, an event that may well itself drive even further increases because of the resulting media attention that it would trigger, while others are predicting that we will soon see the top of this leg. Market prediction is a difficult thing; if it were easy, Bitcoin would have immediately jumped all the way to some final price back in 2009. Perhaps the best strategy for most of us is to simply wait and see.